BPF
实际上,现代内核所运行的都是 eBPF,如果没有特殊说明,内核和开源社区中提到的 BPF 等同于 eBPF。
eBPF 程序在内核版本之间是可移植的,并且可以自动更新。
在 eBPF 之前,内核模块是注入内核的最主要机制。由于缺乏对内核模块的安全控制,内核的基本功能很容易被一个有缺陷的内核模块破坏。而 eBPF 则借助即时编译器(JIT),在内核中运行了一个虚拟机,保证只有被验证安全的 eBPF 指令才会被内核执行。同时,因为 eBPF 指令依然运行在内核中,无需向用户态复制数据,这就大大提高了事件处理的效率。不需要改变内核的源代码或加载内核模块。
换句话说,某种意义上讲 eBPF 虚拟机也提供了一套类似于系统调用的机制:
- 内核通过 syscall 向 User-mode Applications 提供 API
- 内核通过 BPF helper calls 向 kernel-mode Applications 提供 API
截止 2023 年初,内核中的 eBPF 虚拟机中已经有 220 多个 Helper 系统接口,涵盖了非常多的应用场景。
eBPF 还有能力往用户空间任意进程的任意地址写入数据,有限度地修改内核函数的返回值,甚至在内核态直接执行某些系统调用。
bpf-developer-tutorial/src/0-introduce/README.md at main · eunomia-bpf/bpf-developer-tutorial
eBPF学习记录(一)eBPF介绍_小坚学Linux的博客-CSDN博客
BPF 的发展历史,可以参考这个,挺有趣的:eBPF学习记录(一)eBPF介绍_小坚学Linux的博客-CSDN博客
一个专注于 BPF 的组织:eunomia-bpf,可以关注下他们的项目。写裸的 eBPF 程序学习可以参考:eBPF Tutorial by Example 1: Hello World, Framework and Development - eunomia
eBPF 新加了哪些 syscall?/ bpf() / libbpf
只有 bpf(),bpf() 是内核为管理 eBPF 程序、Map 等核心对象而专门设计的唯一系统调用,这是一个多功能系统调用,通过 cmd 来告诉内核应该做什么。
因为这个 syscall 太底层了,所以我们使用一个用户态库也就是 libbpf 进行封装。
BCC (BPF Compiler Collection)
iovisor/bcc: BCC - Tools for BPF-based Linux IO analysis, networking, monitoring, and more
BCC 和 bpftrace 的区别
处于同一生态位,两者是互补的。BCC 允许用多个语言来写,比如 python, lua 等等。
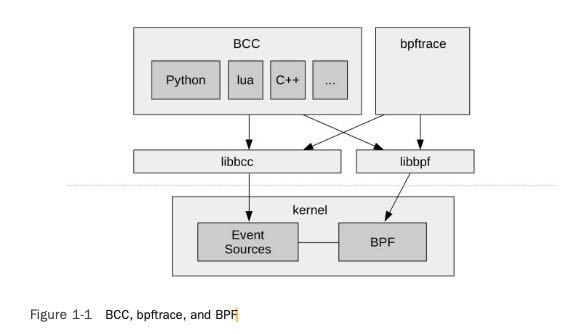
bpftrace
bpftrace/man/adoc/bpftrace.adoc at master · bpftrace/bpftrace
没有看完的部分:
- probes 及后面的部分
- Loops
- Operators and Expressions
所有的 bpftrace 工具都是以 .bt 作为文件后缀名。bpftrace is a high-level tracing language for Linux eBPF.
bpftrace 在 eBPF 和 BCC 之上构建了一个简化的跟踪语言,通过简单的几行脚本,就可以实现复杂的跟踪功能。
可以发现这些函数可以分为 tracepoint(内核静态探针),kprobe(内核态动态函数探针)和 kfunc(基于 BPF 的内核态动态函数探针)三类。kfunc,kprobe 属于不稳定接口,而 tracepoint 则是稳定接口。
相比 kprobes 探针,我们更加喜欢用 tracepoints 探针,因为 tracepoints 有稳定的应用程序编程接口。
没探针的地方是没有办法定位的。
iovisor/bpftrace: High-level tracing language for Linux eBPF
bpftrace 支持脚本编写,只需要在开始处添加 #!/usr/local/bin/bpftrace,会被认为是一个 bpftrace 脚本。
核心语法非常简单:probe[,probe,…] /filter/ { action }。The probe specifies what events to instrument, the filter is optional and can filter down the events based on a boolean expression, and the action is the mini program that runs.
bpftrace 有以下一些 features(可以通过 command line 打开的):
- buffer mode: 用于改善性能和减少跟踪数据丢失的风险。使用该模式后,bpftrace 会将捕获的事件存储到一个临时缓冲区中,并在缓冲区满或者达到指定时间间隔时,批量将数据输出到用户空间。这样可以减少频繁的用户空间和内核空间之间的上下文切换,提升性能;
- 输出到文件
- debug mode:让 bpftrace 有 debug 功能;
- command:允许运行一个子进程,这样 bpftrace 就可以直接监控这个子进程(比如当我们想要监控一个我们自己的应用程序的时候);
- attach to a process
- list probe:列出所有可以进行追踪的 probe 点,如果有符号表的话,应该也能列出来动态追踪的点,比如 uprobe。
- 可以有 Json 格式的输出;
- 其他(dry run、include dir 或者 header 文件、查看 kernel 支持的 feature、list probes、disable feature、)
BEGIN 也算是 probe 的一种。
一个 bpftrace 文件遵循以下结构:bpftrace/man/adoc/bpftrace.adoc at master · bpftrace/bpftrace
bpftrace 支持三元运算符和 if else:
$a == 1 ? print("true") : print("false");
$b = $a > 0 ? $a : -1;

if (condition) {
  ifblock
} else if (condition) {
  if2block
} else {
  elseblock
}
bpftrace 支持 C 里的指针,也支持 C 里的结构体,支持 . 和 -> 访问,我们只能定义一个结构体,但是没有办法使用这个结构体初始化一个变量,只能通过指针指向一个此类型的变量。其实就是我们没有办法为其分配内存空间,定义一个结构体只是为了告诉 bpftrace pointer 指向的内存区域结构是什么样子的。这和数组的逻辑是一样的,数组只是为了告诉 bpftrace pointer 指向的内存区域存了什么东西,长度是多少。
支持元组,和 python 里的元组一模一样。
一些参考的地方:
- A thorough introduction to bpftrace
- bpftrace/docs/tutorial_one_liners.md at master · bpftrace/bpftrace
- 官方最全的文档:bpftrace/man/adoc/bpftrace.adoc at master · bpftrace/bpftrace
Could not resolve symbol: /proc/self/exe:BEGIN_trigger
可以看这里:BEGIN probe not working · Issue #954 · bpftrace/bpftrace
bpftrace 查看内核全局变量的值
// kaddr 函数
printf("jiffies: %lu\n", *kaddr("jiffies"));
Bpftrace config variables
支持通过一个 config block 来给 bpftrace 支持的 config variable 来赋值(必须放在脚本的最前面):
config = {
    // BPFTRACE_STACK_MODE, STACK_MODE, and stack_mode are equivalent.
    // 这三个是同一个 variable
    stack_mode=perf;
    max_map_keys=2
}
bpftrace/man/adoc/bpftrace.adoc at master · bpftrace/bpftrace 这里列出了所有的 config variables。
Bpftrace 语言数据类型 data types
uint8, int8, uint16, int16, uint32, int32, uint64, int64:就是说其实只支持 int 类型。支持变量之前加 (uint16) 来转,比如 (uint16)$x。
Bpftrace 不支持浮点数。
常量只支持:
- decimal (base 10),
- octal (base 8),需要前面加一个 0,比如 0123,
- hexadecimal (base 16),需要 0x 或者 0X,
- scientific(base 10),
可以这么写:1_000_123_000
不支持字符常量,只能通过 ASCII 值来写,比如 printf("Echo A: %c\n", 65);。字符串常量需要双引号。
Bpftrace filters / predicates
Filters (also known as predicates) can be added after probe names. The probe still fires, but it will skip the action unless the filter is true.
Dynamic tracing (instrumentation) and static tracing (instrumentation)
动态追踪是在运行时插入追踪点,这使得对目标系统进行动态分析成为可能,并且不需要事先知道或修改目标程序的源代码。比如可以通过动态更改汇编代码来监控函数调用和返回。程序需要有一个符号表供 bpftrace 使用。比如 kprobes, uprobes 就是利用动态追踪。
静态追踪依赖于在源代码中预定义的追踪点,这些追踪点在编译时就已经存在。一旦被启用,运行时便能直接捕捉由这些追踪点生成的事件。用户态的 USDT, 内核的 tracepoint 都是。
USDT (User Statically Defined Tracing)
用户空间定义的静态追踪点。
BTF (BPF Type Format)
BTF 是 Linux 内核中引入的一种二进制格式,用于描述类型信息和内核数据结构。这类似于调试符号的作用,但更加紧凑和高效,专为 eBPF 程序设计。
bpftrace 可以利用 BTF 信息来自动解析内核数据结构,这减少了用户在编写追踪脚本时需要的预定义头文件和类型。
bpftrace 在运行脚本时默认会尝试读取系统中可用的 BTF 文件内容。
# 使用以下命令解析 btf 文件内容,可以 grep 一下关心的结构体
sudo bpftool btf dump file /sys/kernel/btf/vmlinux

# 查看一个结构体的定义以及各个字段(方式一):
bpftrace -lv 'struct sched_domain'

# 查看一个结构体的定义以及各个字段(方式二):
sudo bpftool btf dump file /sys/kernel/btf/vmlinux format c | grep -A20 "struct sched_domain {"
注意如果有 BTF 就不要继续包含内核头文件了,会被覆盖。
数组(Arrays)in Bpftrace language
和 C 不一样,不能直接构建一个数组比如 int a[] = {1,2,3},只能读进来值,不能改值?
数组可以和 integer 之间互相 cast,比如如果说一个 integer 占用了 8 个字节,那么这个 integer 可以被转成一个 8 项元素的数组。
How to find the corresponding kernel function by the probe?
Tracepoint 类型的,看 DEFINE_EVENT, TRACE_EVENT,或者看文件 include/trace/events/sched.h。
或者直接找 trace + 函数,比如 trace_sched_wakeup()。这些都是静态追踪类型,应该也不会出现在 。
当一个进程被 throttle 时,打印进程的堆栈
#!/usr/bin/env bpftrace

BEGIN {
    printf("Recording stack traces of processes when throttled by CFS\n");
}

tracepoint:sched:sched_stat_runtime /args->delta > 0/
{
    printf("Throttled process: %s (PID: %d)\n", comm, pid);

    // Save user space stack
    printf("User stack:\n");
    print(ustack);

    // Save kernel space stack
    printf("Kernel stack:\n");
    print(kstack);
}

END {
    printf("Script ended\n");
}
统计每秒被 wakeup 的进程的数量
当大量进程被创建时,会被 wakeup,所以当这个高时可以怀疑是短时间内创建了大量进程。
解释,当调用到 tracepoint:sched:sched_wakeup 函数时,将数量加入到 wakeups 变量中去。
interval:s:1 表示每秒钟将 wakeups 内的内容打印出来,然后 clear 为 0 重头开始统计。
# 非新创建进程被 wakeup 数量
sudo bpftrace -e '
tracepoint:sched:sched_wakeup {
    @wakeups = count();
}
interval:s:1 {
    print(@wakeups);
    clear(@wakeups);
}
'
@wakeups: 22906
@wakeups: 28882
@wakeups: 20625
@wakeups: 15266
@wakeups: 22791
@wakeups: 15379
@wakeups: 24034
@wakeups: 16495
@wakeups: 23204
@wakeups: 12092
@wakeups: 19999
@wakeups: 19994
@wakeups: 28248
@wakeups: 14144

# 统计每秒被新创建出来的进程数量
sudo bpftrace -e '
tracepoint:sched:sched_wakeup_new {
    @new_wakeups = count();
}
interval:s:1 {
    print(@new_wakeups);
    clear(@new_wakeups);
}
'
# 可以看到输出数量少很多
Attaching 2 probes...
@wakeups: 16
@wakeups: 70
@wakeups: 0
@wakeups: 87
@wakeups: 86
@wakeups: 188
@wakeups: 108
@wakeups: 121
@wakeups: 9
@wakeups: 101
@wakeups: 106
@wakeups: 114
@wakeups: 120
@wakeups: 128
@wakeups: 49
Probe in bpftrace
除了内核当中的一些函数可以当作 probe 之外,bpftrace 也自己搞了一些 probes,比如:
- BEGIN: 程序开始时;
- END:程序结束时;
- interval:s:5:每 5 秒中触发一次
Variable types in bpftrace
The data type of a variable is automatically determined during first assignment and cannot be changed afterwards. bpftrace knows two types of variables:
-
'scratch': are kept on the BPF stack and their names always start with a
$cannot be accessed outside of their lexical block,使用let进行初始化(也可以指定类型比如let $y: uint8 = 7;)。
let $a = 1;
if ($a == 1) {
  $b = "hello"
  $a = 2;
}
// $b is not accessible here
-
'map': 使用 BPF map,exist for the lifetime of bpftrace itself and can be accessed from all action blocks and user-space. Map names always start with a @, e.g. @mymap.
- scalar map,比如说
@name:@bytes = hist(args.ret);,就表示一个变量,结束时会把这个变量的内容打印出来,没有其他的了。当然,和下面一样,name 也是可以省略的,可以直接@,Values can be assigned directly to maps without a key (sometimes refered to as scalar maps). Note: you can’t iterate over these maps as they don’t have an accessible key.; -
@name[key]/@[key]:hash 类型变量,比如说,@[comm] = count()会给每一个进程的名字(comm)都统计其进入到这个 probe 的数量。然后在 ctrl-c 的时候都打印出来作为一个 map,比如@[nsenter]: 3138,@[pouchd]: 8151等等。@name[key]只是在前面加了个名字,变成了@name[nsenter]: 3138,@name[pouchd]: 8151等等;key 可以是任何内建变量,比如 comm, tid 和 pid。可以用 tuple 作为 key,比如@name[(key1,key2)]。
- scalar map,比如说
Variables with a '@' prefix use BPF maps, which can behave like associative arrays. They can be populated in one of two ways:
- variable assignment:
@name = x; - function assignment:
@name = hist(x);
There are various map-populating functions as builtins that provide quick ways to summarize data.
可以不使用 let 声明直接使用一个 variable。
Bpftrace functions
注意不要和 map functions 混淆。
print, printf, sizeof 等等都是函数。
print 函数可以打印出来普通的值,也可打印出来一个 scalar map,也可以打印出来一个有 key 的 map,with the default formatting for the type.
clear 函数用来清空一个有 key 的 map,而不是一个 scalar map,对于 scalar map,请用 zero 函数。
所有的函数可以看这里:bpftrace/man/adoc/bpftrace.adoc at master · bpftrace/bpftrace
Bpftrace map functions
Map functions are built-in functions who’s return value can only be assigned to map variables.
-
avg:Calculate the running average of n between consecutive calls. -
clear: Clear all keys/values from a map. -
delete: delete a key from a map. -
count: Count how often this function is called. has_keyhist- …
bpftrace/man/adoc/bpftrace.adoc at master · bpftrace/bpftrace
bpftrace 内建变量 / builtin variables
They don’t need a $ or @as prefix。
- comm:当前进程的名字;
- pid:进程标识;
- tid:线程标识;
- arg0, arg1, argn…:传给这个函数的第 n 个参数;
- cgroup:这个 process 属于的 cgroup
- cpu:ID of the processor executing the BPF program,或者说触发时的 CPU
- numaid
- return:从对于当前 probe 的处理中返回,注意后面当条件满足时,这个 probe 还是会触发。
- retval:返回值
- …
bpftrace/man/adoc/bpftrace.adoc at master · bpftrace/bpftrace
BCC official examples
How to install: bcc/INSTALL.md at master · iovisor/bcc
官方给了一堆例子,可以在这里找到:iovisor/bcc: BCC - Tools for BPF-based Linux IO analysis, networking, monitoring, and more
sudo yum install bcc-tools
cd /usr/share/bcc/tools/
# 以统计 TCP 重传为例
./tcpretrans -h
bpftrace 抓网络重传脚本 / tcpretrans
官方给的脚本:https://github.com/bpftrace/bpftrace/blob/master/tools/tcpretrans.bt
cd /usr/share/bcc/tools
sudo ./tcpretrans
会不断输出每一个连接的信息以及状态。
time("%H:%M:%S ");
printf("%-8d %14s:%-6d %14s:%-6d %6s\n", pid, $saddr, $lport, $daddr, $dport, $statestr);

16:25:26 38658  4  33.5.57.111:11211    R> 33.50.132.182:39368  ESTABLISHED
16:25:26 0      4  33.62.111.30:36926   R> 33.54.36.19:8888     FIN_WAIT1
16:25:26 38658  4  33.61.202.16:11211   R> 33.60.204.60:59556   ESTABLISHED
16:25:26 250872 4  33.61.202.16:11211   R> 33.60.204.60:59602   ESTABLISHED
16:25:26 0      4  33.62.111.30:57164   R> 33.61.84.9:8888      FIN_WAIT1
16:25:26 38658  4  11.80.212.79:44244   R> 33.63.68.239:8888    SYN_SENT
16:25:26 167060 4  33.62.111.30:50918   R> 33.63.69.161:8888    FIN_WAIT1
16:25:26 167060 4  33.62.111.30:42834   R> 33.63.69.102:8888    FIN_WAIT1
16:25:26 38658  4  33.62.111.30:58552   R> 33.70.148.38:8888    FIN_WAIT1
16:25:26 38658  4  33.5.57.111:11211    R> 33.70.150.63:57238   ESTABLISHED
16:25:26 38658  4  33.62.111.30:56664   R> 33.8.41.185:8888     FIN_WAIT1
16:25:26 38658  4  33.62.111.30:53762   R> 33.8.41.225:8888     FIN_WAIT1
16:25:26 38658  4  11.80.212.79:41864   R> 33.63.68.36:8888     FIN_WAIT1
16:25:27 38658  4  33.62.111.30:53762   R> 33.8.41.225:8888     FIN_WAIT1
16:25:27 136405 4  33.62.111.30:42834   R> 33.63.69.102:8888    FIN_WAIT1
16:25:27 0      4  33.5.57.111:11211    R> 33.50.255.129:46346  ESTABLISHED
16:25:27 0      4  33.5.57.111:11211    R> 33.50.255.129:46346  ESTABLISHED
16:25:27 38658  4  33.53.197.128:8182   R> 33.44.29.119:58364   ESTABLISHED
16:25:27 0      4  33.62.111.30:12200   R> 33.80.163.80:51238   ESTABLISHED
16:25:27 38658  4  33.61.202.16:43814   R> 33.62.74.228:12220   ESTABLISHED
16:25:27 38658  4  11.80.212.79:51234   R> 33.63.69.102:8888    SYN_SENT
16:25:27 0      4  33.62.111.30:52224   R> 33.8.42.32:8888      SYN_SENT
16:25:28 130592 4  33.5.57.111:42178    R> 33.97.19.40:8110     ESTABLISHED
16:25:28 136405 4  33.62.111.30:42834   R> 33.63.69.102:8888    FIN_WAIT1
16:25:28 38658  4  33.5.57.111:34718    R> 33.97.17.43:8110     ESTABLISHED
统计子网网络流量 tcpsubnet
统计的是发到对应子网的 TCP bytes 的数量,可以转换成更大的单位:./tcpsubnet -f M。
./tcpsubnet                 # Trace TCP sent to the default subnets:
                            # 127.0.0.1/32,10.0.0.0/8,172.16.0.0/12,
                            # 192.168.0.0/16,0.0.0.0/0
./tcpsubnet -f K            # Trace TCP sent to the default subnets
                            # aggregated in KBytes.
./tcpsubnet 10.80.0.0/24    # Trace TCP sent to 10.80.0.0/24 only
./tcpsubnet -J              # Format the output in JSON.
统计会话时长 tcplife
tcplife 总结了在跟踪期间打开和关闭的 TCP 会话。MS 列表示会话持续时间。
# ./tcplife
PID   COMM       LADDR           LPORT RADDR           RPORT TX_KB RX_KB MS
22597 recordProg 127.0.0.1       46644 127.0.0.1       28527     0     0 0.23
3277  redis-serv 127.0.0.1       28527 127.0.0.1       46644     0     0 0.28
22598 curl       100.66.3.172    61620 52.205.89.26    80        0     1 91.79
22604 curl       100.66.3.172    44400 52.204.43.121   80        0     1 121.38
22624 recordProg 127.0.0.1       46648 127.0.0.1       28527     0     0 0.22
3277  redis-serv 127.0.0.1       28527 127.0.0.1       46648     0     0 0.27
22647 recordProg 127.0.0.1       46650 127.0.0.1       28527     0     0 0.21
3277  redis-serv 127.0.0.1       28527 127.0.0.1       46650     0     0 0.26
[...]
统计运行队列的长度 runqlen
bpftrace 有 runqlen.bt,bcc 也有 runqlen binary,两者抓出来的结果是不一样的,看起来还是 bcc 的准一点。
sudo ./runqlen -C
结合 arg 和 retval 两者来抓同一次函数调用的入口和返回值
比如说我们有以下要抓的函数:
static inline struct cfs_bandwidth *tg_cfs_bandwidth(struct task_group *tg)
{
	return &tg->cfs_bandwidth;
}
我们知道我们要关注的 tg 的值是多少(假如是 0x67275e80),我们现在想抓的是当发现这个函数调用传进来的参数 tg 是我们关注的值的时候, 这个函数返回值是多少。如果直接用 kretprobe,那么我们没法对应到 tg 上去,用 kprobe 也没有办法对应到 arg 上去。怎么将这两者关联起来呢?
How to get cgroup path of task in an eBPF program?
Multiple symbol with the same name
如果存在多个符号具有相同的函数名,比如说为了热升级我们有三个 KVM 模块。这三个 KVM 模块都有 kvm_vm_ioctl 这个函数,那么 bpftrace 在跟的时候就会默认跟第一个的地址,如果想避免这个情况指定跟的地址,那么需要 modprobe -r 掉另外两个内核模块。
bcc-tools
安装方式看这里,有两种方式:bcc/INSTALL.md at master · iovisor/bcc
Debian 和 Ubuntu 的安装方式不一样:
# ubuntu
# under /usr/share/bcc/tools
apt-get install bcc-tools
# debian
# under /sbin
apt-get install bpfcc-tools
The BPF Performance Tools Book
一些值的学习的 bpftrace 代码
用 trace1.bt 抓了下 find_next_iomem_res() 拿到全居锁 resource_lock 锁到函数退出的时长,然后又用 trace2.bt,跟踪了下每次 find_next_iomem_res() 中,循环的遍历次数。再用 trace3.bt,抓一下 ffmpeg 在 find_next_iomem_res() 最后找到的 struct resource
// trace1.bt
BEGIN {
  $lock=0xffffffff828b083;
  @lock=$lock*16;
}
kprobe:_raw_read_lock
/(arg0==@lock)&&(comm=="ffmpeg")/
{
  @start[tid]=nsecs;
}
kretprobe:_raw_read_lock
/(@start[tid])/
{
  @get[tid]=nsecs;
  delete(@start[tid]);
}

kprobe:find_next_iomem_res
/(@get[tid])/
{
  $dur=nsecs-@get[tid];
  delete(@get[tid]);
  @stat=stats($dur);
  @lat=hist($dur);

}
interval:s:1 {
  print(@lat);
  clear(@lat);
  print(@stat);
  clear(@stat);
}
// trace2.bt
kprobe:find_next_iomem_res
/(comm=="ffmpeg")/
{
  @count[tid]=1;
}
kprobe:next_resource.part.6
/@count[tid]/
{
    @count[tid] += 1;
}
kretprobe:find_next_iomem_res
/@count[tid]/
{
  $times=@count[tid];
  delete(@count[tid]);
  @stat=stats($times);
  @times=hist($times);

}
interval:s:1{
    print(@times);
    clear(@times);
  print(@stat);
  clear(@stat);
}
// trace3.bt
#include <linux/ioport.h>
kprobe:find_next_iomem_res
/(comm=="ffmpeg")/
{
  @count[tid]=1;
}
kretprobe:next_resource.part.6
/@count[tid]/
{
    @count[tid] = retval;
}
kretprobe:find_next_iomem_res
/@count[tid]/
{
  $p=(struct resource *)@count[tid];
  delete(@count[tid]);
  @times[$p->start]=count();
}
interval:s:1{
    print(@times);
    clear(@times);
}
求物之妙,如系风捕景,能使是物了然于心者,千万人而不一遇也。