2024-12 Monthly Archive
更改 BIOS 配置
依赖一个工具叫做 SCELNX_64。
# 读出来到文件 bios.txt 中
./SCELNX_64 /o /s bios.txt
bios.txt 里面有所有的 BIOS 选项,然后带 “*” 号的是启用的选项。
后面需要做的是将 “*” 改到想要生效的选项前面。然后:
# 将配置写入到 BIOS 中
./SCELNX_64 /i /s bios.txt
All Obsidian events
用于插件开发:**
this.registerEvent(
    this.app.workspace.on('layout-change',()=>this.renameTab())
);
所有的 events 可以在这里找到:EventRef - Developer Documentation
Build the obsidian-title-only-tab Obsidian plugin
npm install
npm run build
^@ In Vim
^@ 是字符串结束符。
ASCII 0-31 部分的所有字符,将编码加上 64 之后对应的全部为可打印字符,于是将 0-31 位置的字符,用 ^ 跟转换之后对应的那个字符绑在一起当作一个字符显示出来,既简洁又实用,——是为“脱字符表示法”。
Bazel and compile_commands.json
看下来这个工具用的人最多:hedronvision/bazel-compile-commands-extractor: Goal: Enable awesome tooling for Bazel users of the C language family.
bazelisk 和 bazel 的关系是什么?
bazelisk 是官方提供的 bazel 包装器(可以理解为要执行的命令,会先被 bazelisk 接收,再分发给 bazel 执行)。同时,bazelisk 也会为当前工作区选择最合适的 bazel 版本。
bazelisk 这是一个封装了 Bazel 的 Go 程序,能自动处理版本选择和下载,确保你总是使用适合的版本进行构建。
CPU steal
Steal Time 是虚拟机进程在物理 CPU 上等待其 CPU 时间的时间百分比。
一个进程的 CPU 利用率和什么有关系?
首先是如何统计的,应该是每隔一段时间看一下当前运行的 code 属于哪个进程,根据这个来计算一段时间内某一个进程的 CPU 占用率。
- 这个进程需要多少 CPU,也就是说这个进程完成任务需要多少的指令。
- 这个进程的 CPI,如果 CPI 高了,那么利用率也会变多。
- CPU 本身的频率,一个更好的 CPU 利用率应该会更低。
Queue sibling
- pod 实际执行的 cpu 时间 / pod 等待和实际执行 cpu 的时间 = pod_onCpu / pod_serveTime ,其中 pod_onCpu = pod_serveTime - (pod_queueSibling + pod_queueOther)
-
serveTime: 在 running queue 中的时间 + 实际执行的时间; -
oncpu: 本 pod cgroup 实际执行的时间; -
queueOther: 被非同级的 pod cgroup 组打断等待的时间片总和; -
queueSibling: 被同级的 pod cgroup 打断等待的时间片总和; -
serveTime= oncpu + queueOther + queueSibling
查看 Intel CAT 以及 Memory Bandwidth 限制
cd /sys/fs/resctrl
cat burstable/schemata
L3:0=fff;1=fff
MB:0=100;1=100
cat guaranteed/schemata
L3:0=fff;1=fff
MB:0=100;1=100
查看进程调度延迟
第一种方式:
# schedstat 这个节点是统计的线程颗粒度的信息,而不是进程粒度,单位是 ns
# 分别表示总运行时间、该线程的总调度时延时间、该线程的时间片数
#  1. Time spent on the cpu (in nanoseconds)
#  2. Time spent waiting on a runqueue (in nanoseconds)
#  3. # of timeslices run on this cpu
cat /proc/<pid>/schedstat
3478586269 219004714 451697
第二种方式:
pidstat -p <pid>
Linux 查看 D 进程堆栈
cat /proc/<pid>/stack
查看某一个函数执行时间
如果是用户态的函数:可以用 uprobe,这是一个用户空间探针。
#!/usr/bin/bpftrace

uprobe:/home/zjc/test/sleep_prog:sleep_func
{
    @t_start=nsecs;
}

uretprobe:/home/zjc/test/sleep_prog:sleep_func
/@t_start/
{
    @my_hist = lhist(nsecs - @t_start, 0, 10000000, 50000);
    clear(@t_start);
}
如果是内核里的函数,可以用 kprobe/kretprobe, kfunc/kretfunc 组合:
sudo bpftrace -l "kprobe.*" | wc -l
46574
用bpftrace进行性能剖析–统计函数运行时间 – JciX ~
查看每一个 CPU 的 CPU 利用率,并排序
sudo yum install sysstat
mpstat -P ALL 1 1 | awk '/^[0-9]/ { printf "CPU%s: %.2f%\n", $3, 100-$13 }' | sort -t: -k2 -nr
周期性监控一个 pod CPU 利用率并绘图
import os
import time
from datetime import datetime


def read_cpuacct_usage():
    with open('cpuacct.usage', 'r') as f:
        for line in f:
            return int(line)

def cal_quota_cores():
    with open('cpu.cfs_quota_us', 'r') as f:
        quota = int(f.readline().strip())
        with open('cpu.cfs_period_us', 'r') as fp:
            period = int(fp.readline().strip())
            return quota / period
    return 0


def read_cpu_stat():
    throttled_stats = {}
    with open('cpu.stat', 'r') as f:
        for line in f:
            parts = line.split()
            if len(parts) == 2:
                key, value = parts
                throttled_stats[key] = int(value)
    return throttled_stats


cpu_usages = []
throttle_events = []
burst_events = []

try:
    initial_usage = read_cpuacct_usage()
    initial_throttle_stats = read_cpu_stat()
    initial_time = time.time()

    while True:
        time.sleep(0.1)

        # Read current stats
        final_usage = read_cpuacct_usage()
        final_throttle_stats = read_cpu_stat()
        final_time = time.time()

        # Calculate CPU usage
        cores = cal_quota_cores()
        cpu_usage = (final_usage - initial_usage) / (final_time - initial_time) / 1e9 / cores * 100
        initial_time = final_time
        cpu_usages.append(cpu_usage)

        # Calculate throttling events
        current_throttle_count = final_throttle_stats.get('nr_throttled', 0)
        current_burst_count = final_throttle_stats.get('nr_burst', 0)
        initial_throttle_count = initial_throttle_stats.get('nr_throttled', 0)
        initial_burst_count = initial_throttle_stats.get('nr_burst', 0)
        throttle_count_diff = current_throttle_count - initial_throttle_count
        burst_count_diff = current_burst_count - initial_burst_count

        # Record throttle events (1 if throttled, otherwise 0)
        throttle_events.append(throttle_count_diff)
        burst_events.append(burst_count_diff)

        # Print current CPU usage and throttle status
        current_time = datetime.now()
        formatted_time = current_time.strftime("%Y-%m-%d %H:%M:%S")
        print(f"{formatted_time} - CPU Usage (quota): {cpu_usage:0.2f}%, CPU Usage (limit): {cpu_usage * 1.2:0.2f}%, throttle: {throttle_count_diff}, burst: {burst_count_diff} {cores} cores")

        # Update initial values for the next calculation
        initial_usage = final_usage
        initial_throttle_stats = final_throttle_stats

except KeyboardInterrupt:
    import matplotlib.pyplot as plt
    # Plot CPU usage and throttle events
    fig, ax1 = plt.subplots()

    color = 'tab:blue'
    ax1.set_xlabel('Time (s)')
    ax1.set_ylabel('CPU Usage (%)', color=color)
    ax1.plot(cpu_usages, color=color, marker='o', label='CPU Usage')
    ax1.tick_params(axis='y', labelcolor=color)

    ax2 = ax1.twinx()
    color = 'tab:red'
    ax2.set_ylabel('Throttle Events', color=color)
    ax2.plot(throttle_events, color=color, marker='x', linestyle='--', label='Throttle Events')
    ax2.tick_params(axis='y', labelcolor=color)

    fig.tight_layout()
    plt.title('Pod CPU Usage and Throttle Events Over Time')
    plt.grid(True)

    import pwd
    sudo_user = os.getenv('SUDO_USER')
    if sudo_user:
        # 获取该用户的信息
        user_info = pwd.getpwnam(sudo_user)
        home_directory = user_info.pw_dir
    else:
        # 如果没有 sudo,直接使用当前用户的 HOME 环境变量
        home_directory = os.getenv('HOME')

    file_path = os.path.join(home_directory, 'cpu_usage_throttle_events.png')
    print(f"Saving to {file_path}...")
    plt.savefig(file_path)

    plt.show()
每个 CPU 上绑定的进程有哪些
import psutil

def main():
    num_cpus = psutil.cpu_count()
    cpu_bound_processes = {cpu: [] for cpu in range(num_cpus)}
    for proc in psutil.process_iter(['pid', 'name', 'cpu_affinity']):
        try:
            pid = proc.info['pid']
            name = proc.info['name']
            affinity = proc.info['cpu_affinity']

            for cpu in affinity:
                cpu_bound_processes[cpu].append((pid, name))

        except (psutil.NoSuchProcess, psutil.AccessDenied):
            continue

    # print
    for cpu, processes in cpu_bound_processes.items():
        print(f"CPU {cpu}:")
        if processes:
            for pid, name in processes:
                print(f"  PID: {pid}, Name: {name}")
        else:
            print("  没有绑定的进程")
        print()


if __name__ == "__main__":
    main()
查看一个 CPU 上的所有内核线程
# 名字被 [] 包围的就是
ps -ef
指定 CPU 上哪一个进程访问内存最多
通过 cache-misses 数来预估出来进程访问内存的数:
sudo perf record -e cache-misses -C 0 -a -o perf.data -- sleep 10
sudo perf mem record -C 0 -t load -o perf.data -- sleep 10
sudo perf script -F comm,pid,event -i perf.data > perf_script.txt
python3 cpu_process_mem_util.py > result.txt
head result.txt
VM Description
docs/devel/migration.rst 的 Stream structure section:
The stream tries to be word and endian agnostic, allowing migration between hosts
of different characteristics running the same VM.
  - Header
    - Magic
    - Version
    - VM configuration section

       - Machine type
       - Target page bits
  - List of sections
    Each section contains a device, or one iteration of a device save.
    - section type
    - section id
    - ID string (First section of each device)
    - instance id (First section of each device)
    - version id (First section of each device)
    - <device data>
    - Footer mark
  - EOF mark
  - VM Description structure
    Consisting of a JSON description of the contents for analysis only
可以看出来 VM Description 是为了分析用的,就是说把所有设备的内容以 JSON 的形式进行了转换。这样我们可以基于 JSON 内容进行分析。
MigrationState 是 per-VM 共享的 global 的,里面的 field vmdesc 表示的就是所有的 VM Description 的数据。
在 qemu_savevm_state_setup 的时候,
qemu_savevm_state_setup
    // 新建一个 vmdesc,JSONWriter^ 类型的
    ms->vmdesc = json_writer_new(false);
    // 打开一个 {} object(因为 JSON 都要以这个开头)
    json_writer_start_object(ms->vmdesc, NULL);
    // 写入 "page_size": target_page_size(),
    json_writer_int64(ms->vmdesc, "page_size", qemu_target_page_size());
    // 写入 "devices": [],
    json_writer_start_array(ms->vmdesc, "devices");
NixOS Download
Index of /nixos-images/ | 清华大学开源软件镜像站 | Tsinghua Open Source Mirror
test_vmxon_bad_cr() / KUT
传进来一个 CR 的值以及 CR 号,然后返回这个 CR flexible(不是必须置上或者必须不能被置上) 的 bits。
对必须置上和必须不能被置上的 bit 进行测试。看看 VMXON 的话会不会出错,如果出错就是正常的。
static int test_vmxon_bad_cr(int cr_number, unsigned long orig_cr, unsigned long *flexible_bits)
{
	unsigned long required1, disallowed1, val, bit;
	int ret, i, expected;

    // 目前只支持 CR0 和 CR4
    // 请注意这两个的定义:
    //  - If bit X is 1 in IA32_VMX_CR0_FIXED0, then that bit of CR0 is fixed to 1 in VMX operation.
    //  - Similarly, if bit X is 0 in IA32_VMX_CR0_FIXED1, then that bit of CR0 is fixed to 0 in VMX operation.
	if (!cr_number) {
        // 根据上面的定义,我们可以得出:
        // 必须是 1 的 bit
		required1 =  rdmsr(MSR_IA32_VMX_CR0_FIXED0);
        // 必须是 0 的 bit
		disallowed1 = ~rdmsr(MSR_IA32_VMX_CR0_FIXED1);
	} else {
		required1 =  rdmsr(MSR_IA32_VMX_CR4_FIXED0);
		disallowed1 = ~rdmsr(MSR_IA32_VMX_CR4_FIXED1);
	}

	*flexible_bits = 0;

	for (i = 0; i < BITS_PER_LONG; i++) {
        // 转成 mask 的形式
		bit = BIT(i);

		/*
		 * Don't touch bits that will affect the current paging mode,
		 * toggling them will send the test into the weeds before it
		 * gets to VMXON.  nVMX tests are 64-bit only, so CR4.PAE is
		 * guaranteed to be '1', i.e. PSE is fair game.  PKU/PKS are
		 * also fair game as KVM doesn't configure any keys.  SMAP and
		 * SMEP are off limits because the page tables have the USER
		 * bit set at all levels.
		 */
		if ((cr_number == 0 && (bit == X86_CR0_PE || bit == X86_CR0_PG)) ||
		    (cr_number == 4 && (bit == X86_CR4_PAE || bit == X86_CR4_SMAP || bit == X86_CR4_SMEP)))
			continue;

        // 如果一个 bit 既不是必须要的,也不是必须不要的
		if (!(bit & required1) && !(bit & disallowed1)) {
            // 如果我们可以安全地写这个 CR
			if (!write_cr_safe(cr_number, orig_cr ^ bit)) {
                // 那么这个 CR 是 flexible 的,记录下来。
				*flexible_bits |= bit;
				write_cr(cr_number, orig_cr);
			}
            // 继续,不用纠缠这个 bit 了。
			continue;
		}

        // required1 和 disallowed 两者不能有重合
		assert(!(required1 & disallowed1));

        // 如果这个 bit 必须是 1,那么我们反而把它去掉
		if (required1 & bit)
			val = orig_cr & ~bit;
        // 如果这个 bit 必须是 0,那么我们反而把它置上
		else
			val = orig_cr | bit;

        // 如果我们写会失败,那么就继续好了。
        // 如果写成功了,那么理应在 VMXON 的时候失败。
		if (write_cr_safe(cr_number, val))
			continue;

		/*
		 * CR0.PE==0 and CR4.VMXE==0 result in #UD, all other invalid
		 * CR0/CR4 bits result in #GP.  Include CR0.PE even though it's
		 * dead code (see above) for completeness.
		 */
        // 我们的预期一定是会在 VMXON 的时候失败的,要么是 UD,要么是 GP
		if ((cr_number == 0 && bit == X86_CR0_PE) ||
		    (cr_number == 4 && bit == X86_CR4_VMXE))
			expected = UD_VECTOR;
		else
			expected = GP_VECTOR;

        // 检测当 CR4/CR0 是某种配置的情况下,VMXON 的结果是否是符合预期的。
		ret = vmx_on();
		report(ret == expected,
		       "VMXON with CR%d bit %d %s should %s, got '%d'",
		       cr_number, i, (required1 & bit) ? "cleared" : "set",
		       expected == UD_VECTOR ? "UD" : "#GP", ret);

        // 写回原来的 CR 值,进行下一次的测试
		write_cr(cr_number, orig_cr);

		if (ret <= 0)
			return 1;
	}
	return 0;
}
Kernel ring buffer
The kernel ring buffer is a data structure that records messages related to the operation of the kernel.
dmesg is used to examine or control the kernel ring buffer.
What does current in kernel mean?
It's a pointer to the current process (i.e. the process that issued the system call).
The current pointer refers to the user process currently executing. During the execution of a system call, such as open or read, the current process is the one that invoked the call. Kernel code can use process-specific information by using current, if it needs to do so. […]
What is the "current" in Linux kernel source? - Stack Overflow
thread_struct In task_struct
WARN_ON
Q: I have a question about assert() in Linux: can I use it in the kernel?
A: The corresponding kernel macros are BUG_ON and WARN_ON. The former is for when you want to make the kernel panic and bring the system down (i.e., unrecoverable error). The latter is for when you want to log something to the kernel log (viewable via dmesg).
Using assertion in the Linux kernel - Stack Overflow
Queues maintained by Linux kernel
Run queue: In Linux, the ready-to-run processes are maintained on a run queue.
schedule()
A process also voluntarily can relinquish the CPU. The schedule() function could be used by a process to indicate voluntarily to the scheduler that it can schedule some other process on the processor.
earlyprintk
[console] early printk实现流程_ooonebook的博客-CSDN博客
How to use:
The kernel’s command-line parameters — The Linux Kernel documentation
Skx & sb
skx: Intel Skylake server Integrated MC
sb: This driver supports the memory controllers found on the Intel processor family Sandy Bridge.
EDAC
EDAC (Error Detection and Correction), it is a Linux kernel model.
EDAC can capture and report error information for hardware errors in the memory or cache, direct memory access (DMA), fabric switches, thermal throttling, HyperTransport bus, and others.
kobject
If you have a struct uio_map structure, finding its embedded kobject is just a matter of using the kobj member.
struct uio_map {
	struct kobject kobj;
	struct uio_mem *mem;
};
given a struct kobject pointer, what is the pointer to the containing structure? use the container_of() macro.
One of the key functions of a kobject is to serve as a reference counter for the object in which it is embedded. As long as references to the object exist, the object (and the code which supports it) must continue to exist.
If all that you want to use a kobject for is to provide a reference counter for your structure, please use the struct kref instead; a kobject would be overkill.
Because kobjects are dynamic, they must not be declared statically or on the stack, but instead, always allocated dynamically.
DDR
Double Data Rate。传统只在上升沿触发传输,DDR 在上升沿和下降沿同时触发,所以叫 double rate。
XFS 文件系统
拷贝文件的时候直接创建一个空的 fd,但是写时复制 COW,读的时候直接读原来的就行,避免过多的拷贝。
HTTPS
HTTPS 在内容传输的加密上使用的是对称加密,非对称加密只作用在证书验证阶段。
Fatal: could not read Username for ‘https://‘: Terminal prompts disabled
因为是在一个非交互式环境,但是又需要输入 git 的账户和密码。
# 注意替换你自己的 server 地址
git config --global url.ssh://git@github.com/.insteadOf https://github.com/
如果这样还不行,那应该得 ssh-keygen 配一下公钥。
SUID
A file with SUID always executes as the user who owns the file, regardless of the user passing the command.
SSH best practice command line
ssh -C -o ServerAliveInterval=180 yunshi.wl@11.129.76.134
Network backend 'user' is not compiled into this binary
Add --enable-slirp in configure option.
Git 的传输协议会加密吗?
有四种传输协议:Git - 协议
All highlight groups provided by Treesitter.nvim
下面命令会提供一个完整的列表:
:h treesitter-highlight-groups
Karabiner / MacOS keys
JoshuaManuel/Karabiner-Elements-Key-List: A reference list of keys recognized by Karabiner Elements
Lsp configs for all language servers
nvim-lspconfig/doc/configs.md at master · neovim/nvim-lspconfig
All the packages that can be installed by mason.nvim
Package list | mason-registry.dev
taskset 和 cgroup 的区别是什么?
cgroup 对上提供的是其他 CPU 被 offlined 了。
taskset 是通过 sched_setaffinity 系统调用来设置 CPU 亲和性的。
Obsidian 中的各种引用方式:
![]():
![[]]:
[[]]:
-
[[2020-07-13]]文件引用; -
[[2020-07-13#大纲]]标题引用; -
[[#大纲]]本文标题引用; -
[[2020-07-13#^块内容]]块引用。
[]():
拿到自己公网 ip
# 办公网 ip 地址
curl ip.sb
# 同上
curl ifconfig.me
# 同上,返回结果更加详细
curl ipinfo.io
Bash 输出重定向
如果想要把 bash 脚本里面的命令的输出也重定向到文件,可以:
sudo ./csx.sh 2>&1 | tee output.log
TD-Shim
confidential-containers/td-shim: Confidential Containers Shim Firmware
替代 OVMF 的位置,只不过是为了 confidential container 里的 TD 里的 firmware。
HTTP 代理和 port mapping
如果用户设置了 http 代理,那么流量模式是怎样的?
export http_proxy=http://127.0.0.1:7890
export https_proxy=http://127.0.0.1:7890
不要求 HTTPS_PROXY 的代理 url 一定是 https 的 ,也不要求 HTTP_PROXY 的代理 url 一定是 http 的,可以都是 socks5 的,表示当访问 http/https 的地址时,通过 socks5 协议先和代理服务器通信,代理服务器再通过 http/https 访问真正的服务器地址。
其实这是一种主动代理的模式,也就是说,需要 App 能 aware 这些环境变量,才会使用这些代理。This is more a convention than a standard, seems to originate from behavior of libcurl HTTP library and curl command line program.
无密码切换 root 用户
sudo su -
Intel CAT
Intel Cache Allocation Technology
CLOS: classes of service.
Cache Allocation Technology (CAT) provides software-programmable control over the amount of cache space that can be consumed by a given thread, app, VM, or container.
通过 CPUID 来枚举这个 feature 支不支持。
The basic mechanisms of CAT include:
- Interfaces for the OS/hypervisor to group applications into CLOS and indicate the amount of LLC available to each CLOS. These interfaces are based on MSRs.
如何使用?resctrl · intel/intel-cmt-cat Wiki
暂时还没有用户态的工具,只能直接去改 resctrl 的 schemata。
Selective IDE stream
Integrity and Data Encryption (IDE) 从名字上就能看出来保证了机密性和完整性。
Obsidian css variables
CSS variables - Developer Documentation
从 guest OS 里怎么知道 userspace VMM 是不是 QEMU?
lspci | grep -i 'qemu'
00:05.0 Non-Volatile memory controller: Intel Corporation QEMU NVM Express Controller (rev 02)
00:06.0 Non-Volatile memory controller: Intel Corporation QEMU NVM Express Controller (rev 02)
00:1f.0 PCI bridge: Red Hat, Inc. QEMU PCI-PCI bridge
ACPI (Advanced Configuration and Power Interface)
前身是 APM (Advanced Power Management) 高级电源管理。
在 ACPI 诞生前,APM 将电源管理几乎完全交给 BIOS,呆板而限制很多,这让微软十分不爽,它希望在电源管理和硬件配置上能有更多的自主权,这也是合理的,谁比操作系统更懂现在用户在干什么呢?
ACPI 作为操作系统和系统固件之间的接口层。 可以说是一种协议,一种数据交换的规范。ACPI 的推广者们一致同意将 ACPI 的属有归到 UEFI 论坛。从那以后新的 ACPI 规格将由 UEFI 论坛制定。
我们可以将 ACPI 可以看作分为两个部分:
- 各种表单 (Tables)。这些表单描述了系统的各种状态,如 MADT,SRAT 等等,这些状态需要 OS 知晓,例如有多少个 CPU(逻辑上),NUMA 亲缘关系如何,APIC 等等。
- 由 Differentiated System Description Table (DSDT) 和 Secondary System Description Table (SSDT) 指向的 AML 代码。这是一种 ACPI 规范规定的伪代码)。ASL 程序提供了OS 和固件调用的接口 (method)。ACPI 定义了很多预定义的 Method,通过它们,OS 和 firmware 互相传送信息(例如 主板 PCI 设备树,IRQ,OS 支持哪些功能等等);OS 还可以调用 firmware 提供的接口;固件从 OS 那里能得到各种事件 (Event) 的通知等等。这点正是 ACPI 强大灵活之处。
DAX (Direct Access)
DAX(Direct Access)是一个与硬件和文件系统两者都有关的功能。它主要由文件系统实现,结合支持该功能的硬件来实现直接访问持久性内存的能力。
是块存储设备的一个功能(feature),怎么知道一个块存储设备支不支持这个功能?
When mounting the filesystem, use the -o dax option on the command line.
对应 O_DIRECT 吧。
For block devices that are memory-like, the page cache pages would be unnecessary copies of the original storage. The DAX code removes the extra copy by performing reads and writes directly to the storage device. For file mappings, the storage device is mapped directly into userspace. Without DAX support in a file system, the page cache is generally used to buffer reads and writes to files, and requires an extra copy operation.
kernel.org/doc/Documentation/filesystems/dax.txt
冲突域,广播域
冲突域:同一时间内只能有一台设备发送信息的范围。
第二层设备能隔离冲突域,比如 Switch。交换机能缩小冲突域的范围,交换机的每一个端口就是一个冲突域。
广播域:如果站点发出一个广播信号,所有能接收收到这个信号的设备范围称为一个广播域。
第三层设备才能隔离广播域,比如 Router。路由器能隔离广播域,其每一个端口就是一个广播域。
- 二层广播报文:当二层交换机收到一个报文时,会取出报文的目的 MAC 地址,如果 MAC 地址为全 FF(
ff:ff:ff:ff:ff:ff),则这个报文就是二层广播报文。 - 三层广播报文(路由器广播报文,ip 广播报文):这个不是路由器能隔离的。
taskstats / getdelays / Get context switches for a thread group in Linux
首先需要先编译 getdelays 这个命令。找到对应 kernel 版本的 source code,直接 copy 下来,保存成一个文件 getdelays.c。
gcc -I/usr/src/linux/include getdelays.c -o getdelays
# get accounting for a tgid, vo / non-vol
sudo ./getdelays -q -t 99135
如果要计算一段时间内的变化:
#!/bin/bash

# 写死的进程 ID 列表
# 先 LSR,再 LS
PIDS=(241940 10353 99135 9546 241108 240492 9067 10096)

declare -A initial_voluntary_map
declare -A initial_nonvoluntary_map
declare -A final_voluntary_map
declare -A final_nonvoluntary_map

# 获取初始值
for PID in "${PIDS[@]}"; do
    initial=$(sudo ./getdelays -q -t $PID | tail -n 1)
    initial_voluntary_map[$PID]=$(echo $initial | awk '{print $1}')
    initial_nonvoluntary_map[$PID]=$(echo $initial | awk '{print $2}')
done

sleep 30

# 获取最终值
for PID in "${PIDS[@]}"; do
    final=$(sudo ./getdelays -q -t $PID | tail -n 1)
    final_voluntary_map[$PID]=$(echo $final | awk '{print $1}')
    final_nonvoluntary_map[$PID]=$(echo $final | awk '{print $2}')
done

# 计算变化并输出结果
index=0
echo "===================="
echo "LSR:"
for PID in "${PIDS[@]}"; do
    index=$((index + 1))

    if [ $index -eq 5 ]; then
        echo "===================="
        echo "LS:"
    fi

    initial_voluntary=${initial_voluntary_map[$PID]}
    initial_nonvoluntary=${initial_nonvoluntary_map[$PID]}
    final_voluntary=${final_voluntary_map[$PID]}
    final_nonvoluntary=${final_nonvoluntary_map[$PID]}

    diff_voluntary=$((final_voluntary - initial_voluntary))
    diff_nonvoluntary=$((final_nonvoluntary - initial_nonvoluntary))

    echo "PID: $PID"
    echo "Voluntary context switches increased by: $diff_voluntary"
    echo "Nonvoluntary context switches increased by: $diff_nonvoluntary"
    echo ""
done
handle_io() KVM
[EXIT_REASON_IO_INSTRUCTION]          = handle_io,
static int handle_io(struct kvm_vcpu *vcpu)
{
	unsigned long exit_qualification;
	int size, in, string;
	unsigned port;

	exit_qualification = vmx_get_exit_qual(vcpu);
    // 判断是否为 string io (ins, outs)
	string = (exit_qualification & 16) != 0;

	++vcpu->stat.io_exits;

    // 如果是 ins, outs 这种,那么走这条路
	if (string)
		return kvm_emulate_instruction(vcpu, 0);

    // 端口号
	port = exit_qualification >> 16;
    // 大小
	size = (exit_qualification & 7) + 1;
    // 判断 io 方向,是 in 还是 out
	in = (exit_qualification & 8) != 0;

	return kvm_fast_pio(vcpu, size, port, in);
}
TDX CI Mode / LI Mode
MKTME 只能保证机密性,但是保证不了完整性,TDX 引入这两个 mode 来保证完整性。
Cryptographic integrity & logical integrity mode.
短期高 CPU 利用率 CPU 在执行哪些代码?
Linux 中 x86 平台中断处理流程 / 中断 context switch
中断发生时:
- X86 硬件自动压栈(保存原来现场);
中断就是当硬件有事件发生的时候,硬件会自动从一个地址开始执行指令,这个地址是在哪里设置上的?
- 中断向量压栈
中断的 context switch 是不是不会切换 CR3 页表。
do_IRQ
    // Context-switch in
    // 把中断相关的寄存器先写进去
    old_regs = set_irq_regs(regs)
    // Context-switch out
    set_irq_regs(old_regs);
中断嵌套
Linux 支持中断嵌套吗?曾经是支持的,现在已经不支持了!
具体原因可以看这里:Linux的中断可以嵌套吗? - 知乎
Why emulating MMIO using EPT misconfiguration?
当发生 EPT violation 时,我们能不能通过判断发生 EPT violation 对应的 EPT 页表项来判断是否是因为页表未建立还是 MMIO。应该是可以的,但是这样很麻烦,还得去遍历 EPT 页表拿到对应的页表项并分析是不是一个 MMIO(因为可能和正常 EPT Violation 弄混),这样比较复杂,而 EPT Misconfiguration 可以直接判断为 MMIO:
handle_ept_misconfig
    // 直接传入了 PFERR_RSVD_MASK 来表示 error code,直接判断为一个 MMIO
    kvm_mmu_page_fault(vcpu, gpa, PFERR_RSVD_MASK, NULL, 0);
        x86_emulate_instruction
            //...
            // 通过 ioeventfd 通知到 QEMU
            ops->write[ioeventfd_write]
EPT violation/misconfiguration 都是一种 fault,当发生 fault 的时候,guest 触发 fault 的指令还会被执行一次。比如 guest 访问一个页触发了 EPT violation,VMM 在 handle 完之后,guest 的 RIP 并没有变,还是会重新执行这一条指令。kvm 里有 kvm_skip_emulated_instruction() 函数可以跳过当前指令。
Current VMCS, Active VMCS, Launched VMCS
一个物理 CPU 上只能有至多一个 current 和 launched 的 VMCS。
- Active:
VMCLEAR之后,VMPTRLD之前一都是这个状态,状态被这两个指令控制;一个进程在VMPTRLD之后,无论再怎么执行VMPTRLD, load 别人还是自己,都会保持 Active,直到执行VMCLEAR。 - Current: 表示如果要
VMLAUNCH,应该选择哪一个进行 launch,使用VMPTRLD/VMCLEAR来更改此状态; - Launched: 表示这个 VMCS 有没有第一次被执行过,通过指令
VMLAUNCH来更改此状态。
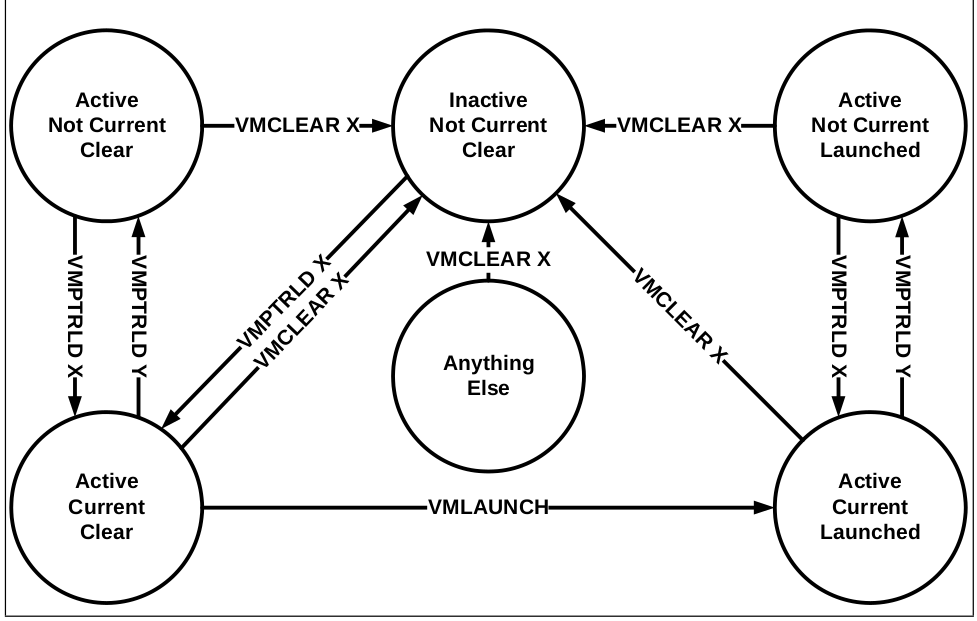
VMPTRLD 其实可以看作是将执行此指令的物理 CPU 和 VMCS 绑定,VMCLEAR 就是把一个 VMCS 和其所绑定的 CPU 解绑,尽管执行 VMCLEAR 的 CPU 可能和 VMCS 绑定的 CPU 不是同一个 CPU。
Async-fork
fork() 大部分时间消耗在复制父进程复制自己的页表内容给子进程(占据 fork 调用耗时的 97% 以上)。
Async-fork 设计的核心思想是将 fork 调用过程中最耗时的页表拷贝工作从父进程移动到子进程,缩短父进程调用 fork 时陷入内核态的时间,父进程因而可以快速返回用户态处理用户查询,子进程则在此期间完成页表拷贝。
VLDB 顶会论文 Async-fork 解读与 Redis 实践-51CTO.COM
task_struct Kernel
struct task_struct {
    //...
    // 并没有一个直接的成员指向 cgroup, 而是指向了 css_set 的结构,
    // 因为一个 cgroup 可以挂载很多 subsystem 下面,所以我们用很多 css
    // 表示同一个 cgroup 的多个 subsystem,这是一种很间接的方式
    // css_set 存储路与进程相关的 cgroup 信息。
	struct css_set __rcu		*cgroups;
    //...
}
irqbalance / IRQ 亲和性 / IRQ affinity
Irqbalance/irqbalance: The irqbalance source tree - The new official site for irqbalance
是一个服务,中断 irq(比如说网卡的中断号)是绑在 CPU 上的,有的 irq 发生比较频繁,有的没有那么频繁,让 irq 重新分配其 CPU 从而让负载变得平均。
当配置了 IRQ 亲和性之后,其实是
CPU 使用率怎么计算
执行 top 命令:我们能看到下面这一行:
%Cpu(s): 0.9 us, 0.7 sy, 0.0 ni, 98.4 id, 0.0 wa, 0.0 hi, 0.0 si, 0.0 st
这里面所有的参数都是不重合的,且加起来等于 100%。ni 和 user 分别代表了 nice 值大于 0 的进程的用户态开销和 nice 值小于 0 的进程的用户态开销。加起来是整体的用户态开销。
st 表示的是 steal time,cgroup 的 cpuacct.proc_state 下面的是另一个意思,和虚拟化没有关系,可能代表的是这个 cgroup 被 host 上的其他进程抢走的时间。
如果要计算一个 CPU 使用率,可以把上面的和为分母,把关注的那部分作为分子,除即可。
AMD CCD/IOD/CCX
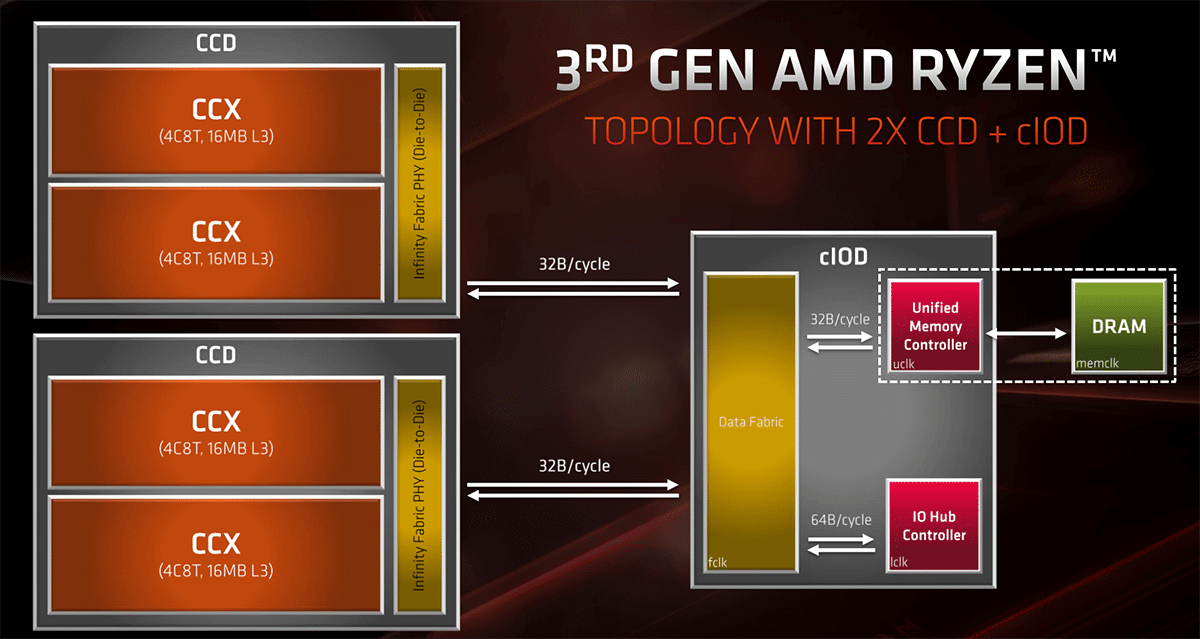
- CCX = Core CompleX, currently 4 Cores that share some L3 cache. houses half of cores within a single CCD
- CCD = Core Chiplet Die, a Chiplet with CPU cores on it. (Currently 2 CCX with 4 cores each, with Zen3 probably 1 CCX with 8 Cores), houses 2 CCX'es
With the Zen 3-based Ryzen 5000 and Milan processors, AMD aims to discard the concept of two CCXs in a CCD. Instead,we’re getting an 8-core CCD (or CCX) with access to the entire 32MB of cache on the die.
There are pros and cons to having the CCX be Ryzen’s basic functional unit.
- A negative is that the baseline cost of manufacturing can be somewhat on the high end since AMD needs to pay for a minimum of four cores. However, this is offset by the fact that Team Red salvages partially functional CCXs with, say, two or three functional cores, to create different SKUs. For example, the Ryzen 5 5600X features two CCXs/CCDs, each of which has one core disabled, for a total of 6 functional cores. 4 个核为粒度的缺点是,只能以 4 个核为单位来卖,不够精细化,但是后面 AMD 学苹果,禁掉了一个核来卖。开核^就是 AMD 公司在生产四核的工程中,生产出来的核心不是每个都达到技术要求,为了降低成本和 CPU 的功耗,于是厂家将没有达到要求的核心屏蔽掉,就有了原生四核架构的双核和三核 CPU。开核的意思就是把被屏蔽掉的核心打开。能开核的 CPU 都是有缺陷的 CPU,虽然开核后可以提高 CPU 的性能,但同样有可能会引起频繁停机或死机,不能进系统,甚至破坏 CPU 的可能。所以,开核后工作不稳定的话最好就别勉强,以系统可以稳定运行为准。
Intel 没有使用模块化设计,如果制造过程中出现了缺陷就扔掉,对于核数少的来说,这样是合理的:双核来说这样成本反而更低。
Costs increase exponentially with larger designs. When you get to 10 cores and more, it’s virtually guaranteed that for every functional CPU, Intel discards at least one defective part: keep in mind, only one core needs to be non-functional for the part to be scrapped. 10 core CPU 几乎是造一个就要扔掉一个。
SPR 开始,Intel 开始使用 chiplet design。
How to define new CPU model in QEMU
对于 CPUID 类型的 FeatureWord,考察两部分:
-
-cpu host会SET_CPUID置上的 bit; -
-cpu <Model>会SET_CPUID置上的 bit。
In SET_CPUID when -cpu host
|
In SET_CPUID when cpu <model>
|
Output |
|---|---|---|
| 0 | 0 | 硬件或者 KVM 不支持这个 CPUID。(如果是 KVM 不支持但是硬件支持,应该等待 KVM 支持后再 introduce CPU Model) |
| 0 | 1 | Won't happen. host 已经是尽可能 passthrough 了,如果 host 没有这个 CPUID,CPU Model 也大概率没有。 |
| 1 | 0 |
-cpu host 有,说明这个 CPUID 是被虚拟化的了(KVM 支持)并且 migrate-safe 的(migratable),所以可以加到 CPU Model 当中。但是非必须,因为可能会有其他考虑,比如 RTM 和 HLE 就被 disable 掉了,类似还有 SGX, SGXLC。 |
| 1 | 1 | Do nothing. 这种是无论 host 还是 model 都会自动加上去的,比如 FEAT_XSAVE_XCR0_LO (x86_cpu_enable_xsave_components())。 |
还有一些是 KVM 不会 report support,但是 QEMU 会置上的,比如 CPUID_HT。这部分 CPUID 在 kvm_arch_get_supported_cpuid() 函数中进行了处理。
对于 MSR 类型的 FeatureWord,考察两部分:
-
-cpu host,+vmx,+pmu会kvm_init_msrs()里置上的 bit; -
-cpu <Model>,+vmx,+pmu会kvm_init_msrs()置上的 bit。
处理方式同上(区别是 SET_CPUID 换成 kvm_init_msrs())。
CPU sys
Page fault 高可能导致 sys 偏高。因为服务器端一般是关了内核抢占 CONFIG_PREEMPT 的,所以即使进程的优先级很低,其在处理 page fault 的时候是在内核态,也是无法被抢占的,可能会导致高优任务的调度不达我们的预期。
一个 Pod 的 Load 和什么有关系?loadr / loadd
正常范围一般是在 100 以内。
Load 一般都是针对单个 CPU 来说的,对于 CPU 上执行的不同线程一般不说 load 这个概念。当平均负载(平均活跃进程数)不大于 CPU 逻辑核数时,系统可以正常运转。理想状态下,系统满负荷工作,此时平均负载 = CPU 逻辑核数(4 核 8 线程 CPU 有 8 个逻辑核)。但是,在实际生产系统中,不建议系统满负荷运行。通用的经验法则是:平均负载 <= 0.7 * CPU 逻辑核数。
- 当平均负载持续大于 0.7 * CPU 逻辑核数,就需要开始调查原因,防止系统恶化;
- 当平均负载持续大于 1.0 * CPU 逻辑核数,必须寻找解决办法,降低平均负载;
- 当平均负载持续大于 5.0 * CPU 逻辑核数,表明系统已出现严重问题,长时间未响应,或者接近死机。
CPU 使用率与 load 的关系:load 不仅包括正在使用 CPU 的进程,还包括等待 CPU 或 I/O 的进程。因此 CPU 使用率是包含在 load 内的。这两个参数有两种组合需要注意:
一个 cgroup 的 load 一般是看每次采样时 cgroup 里的进程在 run queue 的数量的平均。特定时间间隔内运行队列中的平均线程数,是一个统计上的而不是瞬时的概念。
r 就是 running 的进程的数量、d 就是 deactivate 的进程数量。loadr 和 loadd 貌似是内部的说法,没找到外面有关于 loadr 和 loadd 的文档。
关于 D 状态的一些内容在 Linux 进程状态^中。
为什么在硬件/外设交互的过程中进程不能打断执行其他流程呢?/ EINTR
EINTR: Many system calls will report the EINTR error code if a signal occurred while the system call was in progress.
进程的信号处理时间是在进程从内核态返回用户态的时候,会检查如果有信号那么就会执行对应的 handler 来进行这个信号的处理流程。这个时候原本 syscall 要执行的内容已经处理完了,为什么会影响到硬件/外设的交互呢?
因为虽然是在内核态往用户态返回的时候才处理信号的,不一定就代表原来的工作做完了,原来进程 wakeup 是在等资源,资源到了才能 wakeup,而信号来的时候 wakeup 了,说明本来我们要等的资源还没有好,这种 wakeup 其实是一种打断的 wakeup,所以我们才要判断是否有信号发生,进入另一个分支 ret = -EINTR 并返回 EINTR 让用户态重新调用一次 syscall。但是如果我们返回了用户态,用户态怎么知道什么时候 IO 完成呢?如果用户态重新调了一次 syscall,会不会在 IO 的时候和上一次 IO 产生冲突呢?这其实都是有可能的。
The introduction of interruptible sleeps is likely to lead to application bugs.
因为发送信号时会唤醒正在睡眠的信号的接收者。主要考虑还是基于编程的便利性。Kernel code which uses interruptible sleeps must always check to see whether it woke up as a result of a signal, and, if so, clean up whatever it was doing and return -EINTR back to user space(这样 userspace 可能重新调用这个 syscall 来完成未完成的内容,因为系统调用的 sleep 被信号打断了而不是真的资源好了,所以需要做 cleanup 来清空之前已经完成的内容,所以相当于这个 syscall 没有被调用,需要重新被调用,这给编程尤其是内核态的编程带来了很大的难度)。所以应该是:
- 一部分原因是这样可以简化内核态的编程,不需要做状态的 revert 操作;
- 另一部分原因是有一些和硬件相关的状态的确也没有办法做 revert 操作。
Why does load include processes in the D state?
Load 首先不只是指 CPU 负载,其表示的是整个系统的负载,因此,IO 上的负载其实也是系统负载的一部分。
load = loadr + loadd,其实就是表示系统负载表示 CPU 上的负载加上 IO 上的负载(大体上)。
Processes in the D state are typically waiting for I/O operations to complete. While they are not directly using the CPU at that moment, they are still active and waiting for resources. High numbers of such processes can be indicative of resource contention, such as congestion on disks, network, or other I/O subsystems. Therefore, it is important to consider these processes when evaluating system load.
D state in kernel / TASK_UNINTERRUPTIBLE / D 状态线程
D 线程没有办法响应 kill -9 的原因,就是因为即使内核把它唤醒,这个进程不会处理 signal_pending 从而触发 abort,而是会在发现条件不满足时再度睡眠,而 S 线程再接收到 kill -9 后会马上醒来,处理信号,abort 并退回用户态。D 线程是屏蔽了信号处理,而不是屏蔽了 CPU 对硬件中断的响应。
Linux 之所以要设计 D 状态,是为了保护某些内核关键操作(如磁盘 I/O)的数据完整性,避免被意外打断。这里的意外打断指的是被信号打断从而去处理信号,而不是被调度打断。也就是在 D 状态中,我们是可以 schedule() 主动调度,或者被抢占的,这都没有关系。
D 状态线程的堆栈都是在内核态,而不是用户态。一般就是卡住了,因为只有卡住才会在内核代码中 set_current_state 之后不 set 回来,是卡在了中间的部分。
宋宝华: 聊一聊进程深度睡眠的TASK_KILLABLE这个状态-CSDN博客
前置知识,复习一下信号^。这个 INTERRUPIBLE 还是 UNINTERRUPTIBLE 的名字指的就是能不能马上处理 signal 的中断。因此,D 状态连 kill -9 的信号都不会响应。
TASK_UNINTERRUPTIBLE 接收到信号时,也不是就直接忽略了,处理信号的时机和 TASK_INTERRUPTIBLE 接收到信号时是一样的,都是在内核态返回到用户态的时候。
但是区别在于,TASK_UNINTERRUPTIBLE 的代码不会在内核态醒来时发现是 signal 就直接放弃现有逻辑去 revert 并 ret = -EINTR 最后返回 -EINTR(见信号处理流程),而是等到真的资源完备后唤醒然后设置为 TASK_RUNNING 之后在返回用户空间的时候去处理信号(也就是中间我们不会加 signal_pending() 的检查)。相反,调用 __set_current_state(TASK_INTERRUPTIBLE) 并 schedule() 出去的进程,醒来第一件事往往就是通过 signal_pending(current) 查看信号是否存在,如果存在,就跳出去处理信号,走标准的信号处理流程,无需等待 I/O 的完成(大不了信号处理完了再重新 read):

其实可以分析出来,TASK_INTERRUPIBLE 状态和 TASK_UNINTERRUPTIBLE 状态其实仅仅是个标签,其醒来动作并不是强制性的,而是通过内核代码保证的,比如内核代码人为保证了醒来时先处理 pending 的 signal。
这个状态通常在进程必须等待时不受干扰(比如磁盘读) 或所等待的事件很快发生时使用。
The most common way that processes enter D state is Creating controllable D state (uninterruptible sleep) processes:
- while doing DMA transfers and other hardware interactions (IO), DMA, for example, allows hardware subsystems to access the main system memory for reading/writing independently of the CPU, which is essential for efficient handling of large volumes of data. Because this access is gated as part of the process context itself, programs generally must not be interrupted in the midst of such operations because DMA transfers are not typically designed to accommodate or recover from partial or interrupted reads or writes.
- and while waiting for certain kinds of kernel synchronisation primitives(等锁).
我们可以查看 kernel 代码中进程进入 D 状态的一些例子。set_current_state() 函数给了我们一个模版,一般来说一个流程应该是这样的:
for (;;) {
    // 从置为此状态到调用 schedule() 之间的时间很短,
    // 所以应该不至于造成统计上的误差。
    set_current_state(TASK_UNINTERRUPTIBLE);
    // 我们在等一个资源,需要确认这个资源是否已经准备好了。
    // 其实即使我们把 task 设置成 interruptible 的,这里被信号打断了
    // 那么 condition 不满足我们还是会一直 schedule 下去吧,并不会走到
    // 信号的执行流程当中去。
    // 这样其实就没有必要 enable signal interrupt,因为反正来了信号也不会
    // 及时做处理,还是在这里等。
    // D 状态是可以 schedule 出去的。
    if (CONDITION)
        break;
    schedule();
}
// 从 schedule 返回到置为 running 状态之间的时间间隔也很短,
// 所以应该也不至于造成统计上的误差。
__set_current_state(TASK_RUNNING);
我们来看一个套用了这个模版的真实的例子:
// block/blk-mq.c
do {
    if (blk_mq_rq_state(rq) == MQ_RQ_COMPLETE)
        break;
    // 置状态
    set_current_state(TASK_UNINTERRUPTIBLE);
    hrtimer_sleeper_start_expires(&hs, mode);
    if (hs.task)
        // 调度
        io_schedule();
    hrtimer_cancel(&hs.timer);
    mode = HRTIMER_MODE_ABS;
} while (hs.task && !signal_pending(current));
// 置状态
__set_current_state(TASK_RUNNING);
Linux 在内核态的时候也会发生抢占调度。为什么只在调用 schedule() 的时候进行保护呢? 如果其他时候发生了抢占调度,那么我们此时没有进入 uninterruptable state,期间出现了 signal,我们岂不是需要处理并返回 -EINTR?
这是因为抢占调度后进程不会进入 sleep 状态而是会回到运行队列中成为 runnable 状态。这个时候收到信号只是 queue 住,当调度回来时,还是会执行后面的逻辑,如果后面有 ret = -INTR 以及 signal_pending() 的处理逻辑,那么就马上处理 signal,如果没有就 delay 到 ret to userspace 的时候。如果因为我们只是被抢占了,并没有在等什么资源。到返回用户态的时候才会执行信号流。
简简单单一个睡眠一定时间的函数,也用到了 TASK_UNINTERRUPTIBLE 状态,不希望中间被信号打断。这和硬件状态不能被打断没关系,可能只是因为一旦被 signal 打断了,我们也没有办法及时做处理,因为我们没有对应的逻辑去能够让我们及时处理 signal,所以就干脆不开 signal,让 signal 在最后返回用户态时执行。
void __sched usleep_range(unsigned long min, unsigned long max)
{
	ktime_t exp = ktime_add_us(ktime_get(), min);
	u64 delta = (u64)(max - min) * NSEC_PER_USEC;

	for (;;) {
		__set_current_state(TASK_UNINTERRUPTIBLE);
		// Do not return before the requested sleep time has elapsed
		if (!schedule_hrtimeout_range(&exp, delta, HRTIMER_MODE_ABS))
			break;
	}
}
为什么我们不合并 TASK_UNINTERRUPTIBLE 和 TASK_INTERRUPIBLE 呢,看起来仅仅是内核代码里面有没有 signal_pending() 来检查并处理信号呀?
- 清晰度:将两种状态分开可以使代码更容易理解。当我们从用户态看到一个进程处于
TASK_UNINTERRUPTIBLE状态时,我们知道它不会响应信号,而TASK_INTERRUPTIBLE则可以。这种区分使得内核代码的意图更加明确。
Cases that process will enter D state
我们看看一般什么时候会套用这个模版,就知道 D 状态的进程一般是在做什么了。grep 了一下,kernel 当中有 400 多个地方和这个 flag 的值是相关的。我们首先筛选掉非 x86 和 ARM 架构的:
prepare_to_wait
set_current_state
wait_on_bit_lock_io
wait_on_bit_io
wait_on_bit
Colima
第一次启动 Colima 后就不能换 Architecture 了,如果要换,需要执行 colima delete 来删除掉当前的虚拟机,然后运行 colima start x86_64 来启动一个 x86_64 Colima 虚拟机。这需要安装 QEMU。
Profile in Colima
# 这种方式还是一个 ARM 的虚拟机,但是虚拟机里跑的是 x86 的 image?
colima start x86_64

# 这种方式是直接起了一个 x86_64 的虚拟机
colima start --arch x86_64
上面这两种是不一样的。
这里 x86 就是一个 profile。
taskstats
struct taskstats {
	/* The version number of this struct. This field is always set to
	 * TAKSTATS_VERSION, which is defined in <linux/taskstats.h>.
	 * Each time the struct is changed, the value should be incremented.
	 */
	__u16	version;
	__u32	ac_exitcode;		/* Exit status */

	/* The accounting flags of a task as defined in <linux/acct.h>
	 * Defined values are AFORK, ASU, ACOMPAT, ACORE, and AXSIG.
	 */
	__u8	ac_flag;		/* Record flags */
	__u8	ac_nice;		/* task_nice */

	/* Delay accounting fields start
	 *
	 * All values, until comment "Delay accounting fields end" are
	 * available only if delay accounting is enabled, even though the last
	 * few fields are not delays
	 *
	 * xxx_count is the number of delay values recorded
	 * xxx_delay_total is the corresponding cumulative delay in nanoseconds
	 *
	 * xxx_delay_total wraps around to zero on overflow
	 * xxx_count incremented regardless of overflow
	 */

	/* Delay waiting for cpu, while runnable
	 * count, delay_total NOT updated atomically
	 */
	__u64	cpu_count __attribute__((aligned(8)));
	__u64	cpu_delay_total;

	/* Following four fields atomically updated using task->delays->lock */

	/* Delay waiting for synchronous block I/O to complete
	 * does not account for delays in I/O submission
	 */
	__u64	blkio_count;
	__u64	blkio_delay_total;

	/* Delay waiting for page fault I/O (swap in only) */
	__u64	swapin_count;
	__u64	swapin_delay_total;

	/* cpu "wall-clock" running time
	 * On some architectures, value will adjust for cpu time stolen
	 * from the kernel in involuntary waits due to virtualization.
	 * Value is cumulative, in nanoseconds, without a corresponding count
	 * and wraps around to zero silently on overflow
	 */
	__u64	cpu_run_real_total;

	/* cpu "virtual" running time
	 * Uses time intervals seen by the kernel i.e. no adjustment
	 * for kernel's involuntary waits due to virtualization.
	 * Value is cumulative, in nanoseconds, without a corresponding count
	 * and wraps around to zero silently on overflow
	 */
	__u64	cpu_run_virtual_total;
	/* Delay accounting fields end */
	/* version 1 ends here */

	/* Basic Accounting Fields start */
	char	ac_comm[TS_COMM_LEN];	/* Command name */
	__u8	ac_sched __attribute__((aligned(8)));
					/* Scheduling discipline */
	__u8	ac_pad[3];
	__u32	ac_uid __attribute__((aligned(8)));
					/* User ID */
	__u32	ac_gid;			/* Group ID */
	__u32	ac_pid;			/* Process ID */
	__u32	ac_ppid;		/* Parent process ID */
	__u32	ac_btime;		/* Begin time [sec since 1970] */
	__u64	ac_etime __attribute__((aligned(8)));
					/* Elapsed time [usec] */
	__u64	ac_utime;		/* User CPU time [usec] */
	__u64	ac_stime;		/* SYstem CPU time [usec] */
	__u64	ac_minflt;		/* Minor Page Fault Count */
	__u64	ac_majflt;		/* Major Page Fault Count */
	/* Basic Accounting Fields end */

	/* Extended accounting fields start */
	/* Accumulated RSS usage in duration of a task, in MBytes-usecs.
	 * The current rss usage is added to this counter every time
	 * a tick is charged to a task's system time. So, at the end we
	 * will have memory usage multiplied by system time. Thus an
	 * average usage per system time unit can be calculated.
	 */
	__u64	coremem;		/* accumulated RSS usage in MB-usec */
	/* Accumulated virtual memory usage in duration of a task.
	 * Same as acct_rss_mem1 above except that we keep track of VM usage.
	 */
	__u64	virtmem;		/* accumulated VM  usage in MB-usec */

	/* High watermark of RSS and virtual memory usage in duration of
	 * a task, in KBytes.
	 */
	__u64	hiwater_rss;		/* High-watermark of RSS usage, in KB */
	__u64	hiwater_vm;		/* High-water VM usage, in KB */

	/* The following four fields are I/O statistics of a task. */
	__u64	read_char;		/* bytes read */
	__u64	write_char;		/* bytes written */
	__u64	read_syscalls;		/* read syscalls */
	__u64	write_syscalls;		/* write syscalls */
	/* Extended accounting fields end */

#define TASKSTATS_HAS_IO_ACCOUNTING
	/* Per-task storage I/O accounting starts */
	__u64	read_bytes;		/* bytes of read I/O */
	__u64	write_bytes;		/* bytes of write I/O */
	__u64	cancelled_write_bytes;	/* bytes of cancelled write I/O */

	__u64  nvcsw;			/* voluntary_ctxt_switches */
	__u64  nivcsw;			/* nonvoluntary_ctxt_switches */

	/* time accounting for SMT machines */
	__u64	ac_utimescaled;		/* utime scaled on frequency etc */
	__u64	ac_stimescaled;		/* stime scaled on frequency etc */
	__u64	cpu_scaled_run_real_total; /* scaled cpu_run_real_total */

	/* Delay waiting for memory reclaim */
	__u64	freepages_count;
	__u64	freepages_delay_total;

	/* Delay waiting for thrashing page */
	__u64	thrashing_count;
	__u64	thrashing_delay_total;
};
nvcsw / nivcsw / voluntary_ctxt_switches / nonvoluntary_ctxt_switches
source code 中找不到更新的地方?
__schedule
    // 非自愿 switch
    switch_count = &prev->nivcsw;
    // 没有被 preempt
    if (!preempt && prev_state)
        // 自愿 switch
        switch_count = &prev->nvcsw;
    if (likely(prev != next))
        ++*switch_count;
        rq = context_switch(rq, prev, next, &rf);
            // 可以看到 bpf trace 这里和直接读 prev->nivcsw/nvcsw 理论上效果是一样的
            finish_task_switch
求物之妙,如系风捕景,能使是物了然于心者,千万人而不一遇也。